Cost Analysis widget
The Cost Analysis widget allows you to assign a cost factor for each feature you create. These costs are automatically tallied and provide an overall project or event cost. Additional cost factors can be applied, or the entire cost can be scaled based on factors not captured in the data. Costs can be assigned for the edit templates of each layer, and they can be different depending on the area in which the features are created.
Configure settings
This widget can be set to open automatically when
an app starts. Hover over the widget and click the Do not open this widget when
the app starts button  to change the setting to Open this widget automatically when the app starts. (For widgets that you need to add to the app first, you can turn on this option after configuring the widget.)
- Hover over the widget and click the Configure this widget button
 to open the configuration window.
 Note:
Note:If you need to add the widget to the app first, click a widget placeholder on the Widget tab. In the Choose Widget window that opens, select the widget and click OK.
- Check the options to customize your widget. A description of each setting is listed below.
- Once you've configured your settings, click OK to close the dialog box and apply your changes.
There are five sections to consider when configuring the Cost Analysis widget: general settings, project settings, layer settings, costing info, and additional settings.
General settings
The general settings options are as follows:
- Cost Unit—The standard of measure for displaying the length and area of features to be costed.
- Cost Symbol—Displays the cost.
- Round Cost—The rounded final cost of the project.
 Note:
Note:Individual line items are not rounded, only the final result.
- Type of Project Area—As you sketch in features, a boundary of all the features in your project is made. Use this setting to determine the type of area you want.
- Allow users to export report of the project—Users can export a report of all the assets and any additional costs associated with the project. To make changes to the report format, click the edit button. In the Report Setting window, specify the report name, what information to include, and in what order.
Project settings
The project settings options are as follows:
- Define geography for costing—This option allows you to set cost equations of feature templates based on geographies.
- Costing Geometry Layer—If your project consists of different areas of interest, and those areas have different costs associated with them, specify them here. This layer must be a polygon.
- Field to Label Geography—The descriptive field of the costing geometry to display.
- Ability to Save and Load project settings—Configuring these tables and layers allows you to save or load the project.
 Note:
Note:The settings on these tabs are optional. If you decide not to specify any of these parameters, you can still cost out features you sketch on the map. The widget still provides the final cost of all features sketched. It will not save the project, so if you restart the app, all your cost information is removed.
- Project Assets Table—This table associates all drawn features to the project along with any costing geography so that a project can be reloaded at any time.
- Project Multiplier Additional Cost Table—This table stores costs that are not associated with any feature, such as rebates, credits, sponsorships, and rentals.
- Project Layer—This is a polygon feature layer that stores the details of the project along with the net and gross cost of the project.
- Point Layer Centroid—This point feature layer is automatically generated based on the centroid of the project layer.
Layer settings
The Layer settings tab shows all the layers in the map. You can select the layers you want to edit and use for costing out a project. If there are layers that are not editable, the Editable check box will be unavailable. Optionally, you can configure the attribute settings to map project fields to corresponding layer fields.
Costing information
The options on the Costing Info tab are as follows:
- Feature Template—The layers for which you enabled editing on the Layer settings tab are listed here as individual tables. There is a row for each feature template for its corresponding layer. This allows you to cost each feature template independently. You can have more than one of the same feature template as long as you have a different Geography or Scenario setting for each.
- Cost Equation—This is where you define the cost for each feature template.
You can have a fixed number, such as 100. Each time you sketch in a feature from this feature's template, 100 appears in the line item. This text field also supports mathematical expressions. Additionally, there are built-in variables you can access to build complex expressions. These built-in variables are {MEASURE} for the length or area of the feature, {TOTALMEASURE} for the length or area of all the same drawn features, and {TOTALCOUNT} for the count of all the same features. You can build an expression such as {MEASURE} * 100. If you draw a line, the widget will multiply the length of the line by 100 to calculate the cost of that feature.
- Geography—If you specified a cost geography on the Project Settings tab, this drop-down list will show the distinct records.
The Geography option allows you to define cost by geographic area. For example, you have a costing geography that consists of high fire threat regions and low fire threat regions, and you have a feature layer for electric poles. Your feature templates for an electric pole are based on material, and one of the values is wood. For the low fire threat region, you set the cost to x, where x is the base cost of the pole. In the high fire threat region, you set the value of the wood pole to 2x, because it has to be treated to resist fire. If you choose to break down your costing by geography, you need to ensure that for each feature template, you have a none case. This is in case your sketch falls into an area that is outside of any costing geography, but still needs a cost associated with it.
- Scenario—Scenarios behave similarly to geography but without any spatial component. If you have different use cases where you need to have different costs, this is when scenarios are useful. You can manage scenarios by clicking the Manage Scenarios button.
For example, if you have a tree trimming route, you can define different contractors as scenarios so that contractor 1 costs x amount to trim trees and contractor 2 costs y amount to trim trees. The contractors would be added as scenarios. You can have the same scenario in different costing geographies. In this example, contractor 1 can trim in both high and low fire threat regions.
- Actions—Allows you to delete or copy rows.
Additional settings
If there is a need to understand statistical information in your project, use the Additional settings tab to configure those calculations.
- Statistics—Allows you to define statistics that persist to all new projects. You can also build new statistics while using the widget; these statistics are not saved and are lost when the application is reloaded.
- Additional Project Cost—Allows you to define additional project costs that persist to all new projects.
Use the Cost Analysis widget
Complete the following steps to configure the Cost Analysis widget:
- Click the Cost Analysis widget button
 .
.
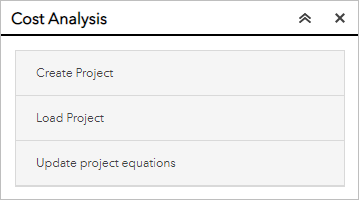
The Cost Analysis window appears with options to create a project, load an existing project, or update project equations in existing projects.
- Click Create Project. Fill in Project Name and Project Description and click Create.
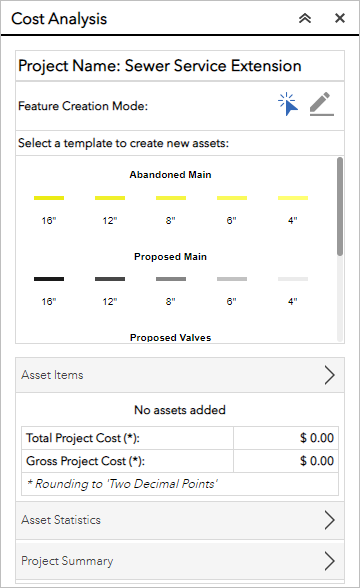
- When your new project loads in the widget pane, explore the following elements:
- Project Name shows the name of the current project you are working on.
- Feature Creation Mode offers options to create assets or replicate the location of existing assets using the template of your choice from the Select a template to create new assets section.
- Asset Items shows the list of assets added on the map, the cost for each item, and the total and gross costs of the design works.
- Asset Statistics allows you to define statistics for your design. Click Add New Statistics to add values based on a field from a layer in your map.
- Project Summary allows you to view and edit project attributes.
- Back
returns to the previous pane. Refresh refreshes the assets from a project layer.
 Note:
Note:If you reload the app without clicking Refresh, the features are still present in the underlying feature layer. You will need to use another widget, such as the Edit widget, to remove the remaining features. If project layers weren't defined in the widget configuration to allow saving and loading projects, clicking Refresh or reloading the app clears all your sketches.
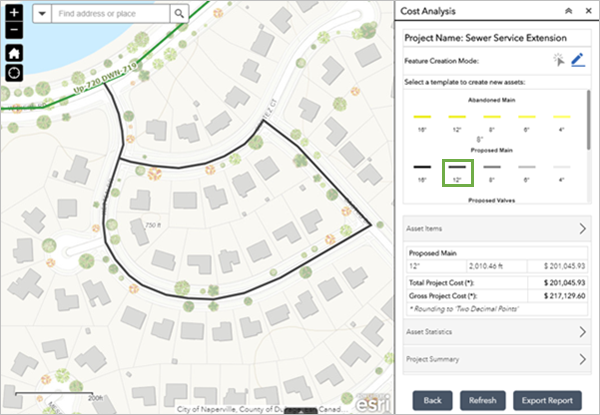
- Say you're a planner at a wastewater utility who wants to know the estimated cost to extend sewer service to a new community located at Cortez Ct, Naperville, Illinois, 60563. Use the feature template picker and choose the 12" Proposed Main and then sketch in the new main on the map. The result shows that the cost to install the mainline sewer pipe is more than $200,000 at $100 per foot with an 8% tax fee, which can be set in the Asset Item Details pane.
- Since you're extending a new service to the area, you need to increase the capacity servicing this new extension. Select the 16" Proposed Main template and click the Feature Mode button
 . Select the mainline just northeast of the new extension.
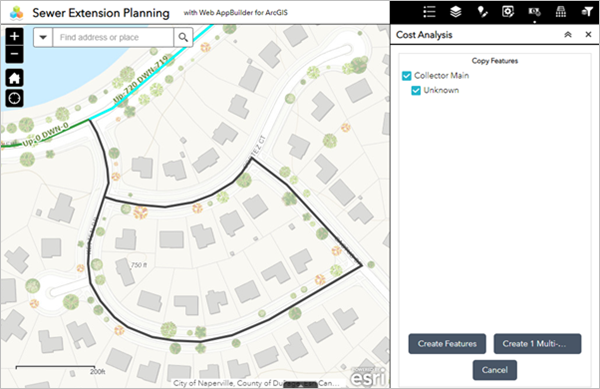
- Copy over all the selected features or uncheck the features you don't want to copy. Click Create Features to create individual features or click Create 1 Multi-Geometry Feature to create a single multipart feature. The results are copied to the 16" Proposed Main layer in the current cost project.
The newly copied feature is now included in your costing project, and the total cost of the project has increased to $500,000.
- This design qualifies for a discount. To determine how much money this will save the project, click the Asset Items arrow.

A detailed view of the cost items appears, allowing you to edit the cost equation.
- Expand Proposed Main.
- Click the Summation button next to the 12" main.
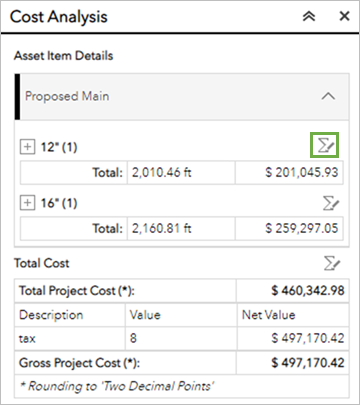
A window appears where you can override the cost equation that was initially set up for this layer.
- Change the value from {MEASURE} * 100 to {MEASURE} * 90 to reflect the $10 discount, and click OK.

You now see the new cost of the mainline pipe and the new cost of the entire design.
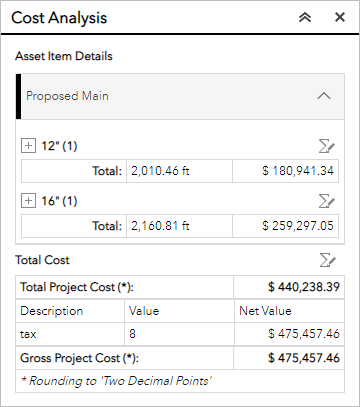
The total cost decreased by approximately $25,000. You're finished with this estimation and can now share the results with the project manager to discuss the next steps.