Business Analyst widget
The Business Analyst widget allows you to view more information about any point or polygon feature on the map, by running reports and infographics for it. The point or polygon feature may be part of a web map layer you opened. The widget also allows you to add a new location by placing a pin on the map and applying rings, drive times, or walk times around it.
 License:
If you include this widget in your app, confirm that your end users have the required privileges described in the Use this widget section.
Configure the Business Analyst widget
This widget can be set to open automatically when
an app starts. Hover over the widget and click the Do not open this widget when
the app starts button  to change the setting to Open this widget automatically when the app starts. (For widgets that you need to add to the app first, you can turn on this option after configuring the widget.)
- Sign in to ArcGIS Online.
- Click Content at the top of the page.
- Click Create and select Web AppBuilder in the list of options.
- In the Create a wep app window, select 2D and specify a title, tags, and summary for your new app.
- Click OK.
Your new app opens in configuration mode.
By default, to access the Business Analyst widget, users must have an organizational account with GeoEnrichment and Network Analysis privileges and available credits. You can configure the app to allow members of an organization who lack these privileges to access the widget through your subscription (and using your organization's credits). Currently, public accounts cannot access the Business Analyst widget.
 Note:
Note:To use the Business Analyst widget in ArcGIS Enterprise, both the GeoEnrichment service and Directions and Routing service must be configured on the portal.
- To allow app users to access the app and widget through your subscription, complete the following steps:
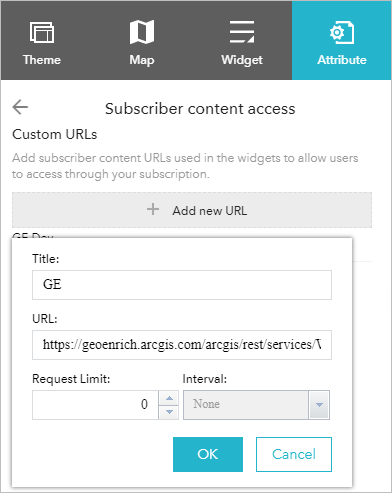
- Click the Attribute tab in the top navigation.
- Click Subscriber content access and click + Add new URL.
- For Title, provide any name. For URL, type the following URL exactly as shown (it's case sensitive): https://geoenrich.arcgis.com/arcgis/rest/services/World/GeoenrichmentServer
- Optionally, set Request Limit and Interval to control the usage, and click OK.
- Click the Widget tab.
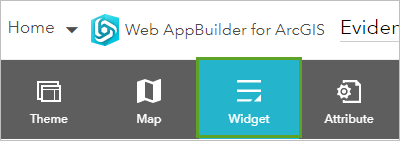
Several widgets are added to your app by default. You can remove these and add any widget into your app using the placeholders.
- Click the Widget 1 placeholder.
- In the Choose Widget window, select Business Analyst and click OK.

- In the Configure Business Analyst window, optionally edit the name field of the widget as it appears in your app. You can also replace the default icon by clicking Change widget icon.
- On the Home tab, optionally modify what appears on the widget's home screen.
- Customize the content and appearance of the text.
 Caution:
If you configured the app prior to version 2.16 and used custom XSS for this content, you may need to modify it to ensure that it appears as expected now because XSS filters have since been implemented for improved security.
- Select which options to include, such as the search box and drawing tools.
- Customize the content and appearance of the text.
- On the Infographics tab, modify the following settings:
- Disable—Check this box to exclude infographics from the widget.
- Export options—Select from the following export options for infographics: Print, Image, PDF, and Dynamic HTML.
- Select country or region—Choose an applicable country or region for the infographics.
- Infographics—Expand the following lists and use the check boxes to deselect any infographic that you don't want available in the widget:
- Esri infographics—Infographics that are available by default.
- My Infographics—Infographic templates that you created in ArcGIS Business Analyst.
- Shared Infographics—Infographic templates that are shared with you by members in your organization.
- Make default—Set the default infographic by pointing to one in the list and clicking Make default. (To remove the default infographic, point to it and click Remove default or set a different infographic as the default.)

 Note:
Note:If you're using ArcGIS Enterprise and including infographics, confirm that the required application files are installed and infographic starter templates are published to the portal so end users can run infographics from the widget
- On the Reports tab, modify the following settings:
- Disable—Check this box to exclude reports from the widget.
- Select country or region—Choose an applicable country or region for the reports.
- Reports—Expand the following lists and use the check boxes to deselect any report that you don't want available in the widget:
- Esri Reports—Reports that are available by default.
- My Reports—Reports that you created in ArcGIS Business Analyst.
- Shared Reports—Reports that are shared with you by members in your organization.
- Make default—Set the default report by pointing to one in the list and clicking Make default. (To remove the default report, point to it and click Remove default or set a different report as the default.)
- On the Rings tab, set the default radius values for applying rings around a point and specify the default units (miles or kilometers). Or you can check the Disable box to exclude rings from the widget.
- On the Drive time tab, set the default drive time values for applying a drive time around a point and specify the default units (minutes, miles, or kilometers). Or you can check the Disable box to exclude drive times from the widget.
- On the Walk time tab, set the default walk time values for applying a walk time around a point and specify the default units (minutes, miles, or kilometers). Or you can check the Disable box to exclude walk times from the widget.
- Click OK to save and close the widget configuration window.
The Business Analyst widget is added to your web app and the icon appears under the Widget window.
 Note:
Note:An ArcGIS Business Analyst Web App license is not needed to run reports and infographics from the Business Analyst widget, including any custom reports and infographics shared with you. (The license is needed to create, modify, and share custom reports and infographic templates using ArcGIS Business Analyst Web App.)
- Click Save to save the web app with the current configuration.
Use the Business Analyst widget
 Note:
Note:To access this widget, you need an organizational account. By default, to run the widget, you must also have available credits and be assigned a role that includes GeoEnrichment and Network Analysis privileges. If you don't have the required credits and privileges, it's still possible to use the widget if the app was configured to allow access through the app owner's subscription.
- Click the widget icon to open the Business Analyst widget.
If a polygon feature is already selected on the map when the widget opened, the screen to choose infographics and reports opens immediately.
 Tip:
Tip:If you want to add a new location instead, click Back.
- If a point feature is selected, you must first apply rings, drive times, or walk times around it.
- Specify desired values of up to three rings, drive times, or walk times.
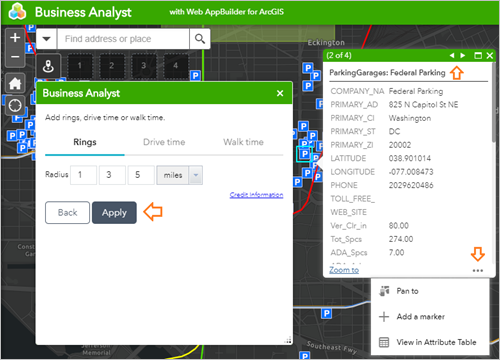
You also have the following options in the pop-up menu for the selected feature:
- Zoom to—Zooms the map extent to the feature.
- Pan to—Pans the map to center it on the feature.
- Add a marker—Show a visual marker on the feature.
- View in Attribute Table—Open the attribute table for the feature.
 Note:
Note:When a symbol represents a cluster of multiple points on the map, click the arrows to cycle through the points.
- Click Apply.
You'll see infographics and reports tabs.
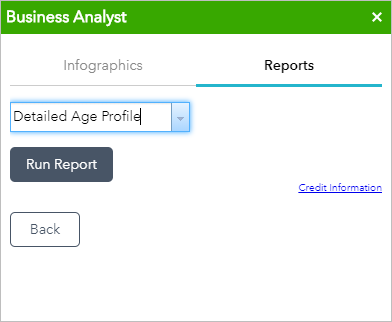
- Click Run Report to run infographics and reports within the area.
In this example, the Detailed Age Profile report is selected.
 Note:
Note:Running reports and infographics uses credits.
 Tip:
Tip:If the widget includes infographics that you can't run, ask your administrator to confirm that the required application files have been installed and that the infographic starter templates have been published to the portal.
- If no feature is selected on the map when the widget opens, you can select a feature on the map and then run infographics and reports for it. Depending on which options are enabled for the widget in the app, you may also be able to search for locations and draw on the map to get related information using the following options:
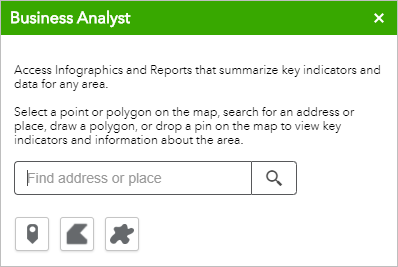
- Enter a place name or address in the Find address or place field to search for a location.
- Click the add point button
 to add a point by clicking on the map.
 - Click one of the polygon buttons to draw an area on the map.
For points, you can apply desired values of up to three rings, drive times, or walk times around it. You can run infographics and reports for the selected or added location or area.
 Note:
Note:Running reports and infographics uses credits.